Key Takeaways
Prioritize Momentum and Engagement Depth
Raw counts like follower numbers or total impressions no longer capture the full impact of your content. What matters now is engagement momentum: how quickly and consistently your posts generate meaningful interactions. Saves, shares, and thoughtful comments signal deeper audience resonance than a spike in likes. Social media managers who track how engagement develops over time gain a clearer understanding of content effectiveness and long-term value.
Automate Analytics for Smarter Tracking
The rise of short-form video and AI-driven feeds has made social activity measurement more complex. Automated analytics tools such as PostNext streamline tracking across platforms. Instead of piecing together spreadsheets, you can check audience growth and post engagement in one dashboard, and add dedicated tools for conversion and customer experience metrics. This approach not only saves time but also helps you identify trends as they emerge.
Take a Comprehensive View: Mix Metrics for Full Impact
No single metric tells the whole story. Combining audience growth, engagement depth, brand awareness, conversion, and customer experience metrics provides a more complete view of your social ROI. For example, steady audience growth with flat engagement may indicate that your content needs a refresh, while high engagement but low conversion can highlight issues with your call-to-action or landing pages. This approach is detailed further in our step-by-step guide to measuring social media efficiency with AI analytics.
Context Matters: Align Metrics With Business Goals
Metrics should always reflect your business objectives. Without clear alignment, it’s easy to focus on vanity numbers. Define what matters most – whether that’s building awareness, driving conversions, or improving customer satisfaction – and set platform-appropriate benchmarks. Tracking progress toward specific goals transforms raw data into actionable insight.
The most effective social media managers in 2026 don’t just report numbers – they use them to make decisions that drive business growth.
How to Filter for Efficiency: The Metrics That Truly Matter
Every social media manager has faced dashboards crowded with numbers and graphs that promise insight but often deliver confusion. In reality, most social media metrics are noise. A select few, however, spotlight what truly drives workflow efficiency and business outcomes.
Why Most Metrics Are Distractions
It’s tempting to chase vanity metrics – follower counts, total impressions, or the raw number of likes. These figures are easy to measure and quick to present, but rarely do they offer a clear picture of what’s working. Likes, in particular, often reflect passive scrolling rather than genuine interest. If you’ve ever celebrated a viral post that resulted in no new leads or sales, you’ve seen this disconnect firsthand.
The Efficiency Lens: Where Impact Meets Action
The most valuable metrics are those that connect your effort to measurable results. Efficiency in social media means tracking not just output (posts published, followers gained) but the outcomes those efforts generate. The best efficiency metrics reveal where your time and resources are well spent – and where they aren’t.
- Momentum metrics show how engagement builds over time, not just in the first hour.
- Conversion metrics link your content to real actions – sign-ups, purchases, downloads – that move the business forward.
- Customer experience metrics such as response time and satisfaction scores highlight operational strengths and pain points, especially as social channels double as customer service hubs.
Effective managers focus on a handful of metrics and set aside the rest. This approach is echoed in the latest industry thinking on social media efficiency, which encourages teams to cut through the clutter and align measurement with business objectives.
The 2026 Shift: Automation, AI, and Actionable Metrics
Measurement has changed dramatically in recent years. Automation and AI tools now help managers focus on the data that matters. AI-driven analytics highlight engagement depth (like meaningful comments or shares), flag content with surging momentum, and attribute conversions more accurately. Unified dashboards pull data from multiple platforms, social listening tools, and customer feedback channels, making it easier to identify which campaigns drive ROI.
What’s trackable – and actionable – in 2026 is fundamentally different from even two years ago. Efficiency now means quickly identifying what works, optimizing in real time, and defending your strategy with numbers that withstand scrutiny. For practical examples of how automation streamlines metric tracking, see this recent guide to automated social media reporting.
Setting Criteria for the Top 5 Metrics
How do you choose the five metrics that matter? Look for those that:
- Directly connect to business goals (revenue, leads, satisfaction)
- Highlight where time and budget are best spent
- Reflect both quantity and quality (not just how much, but how well)
- Can be tracked and acted on using current tools and workflows
- Are understood – and valued – by leadership and stakeholders
The goal isn’t to measure everything. It’s to measure what matters, interpret it in context, and use those insights to create a more effective social media operation.
Efficiency Metrics Comparison Table
Quick-Reference Guide: Five Core Social Media Metrics
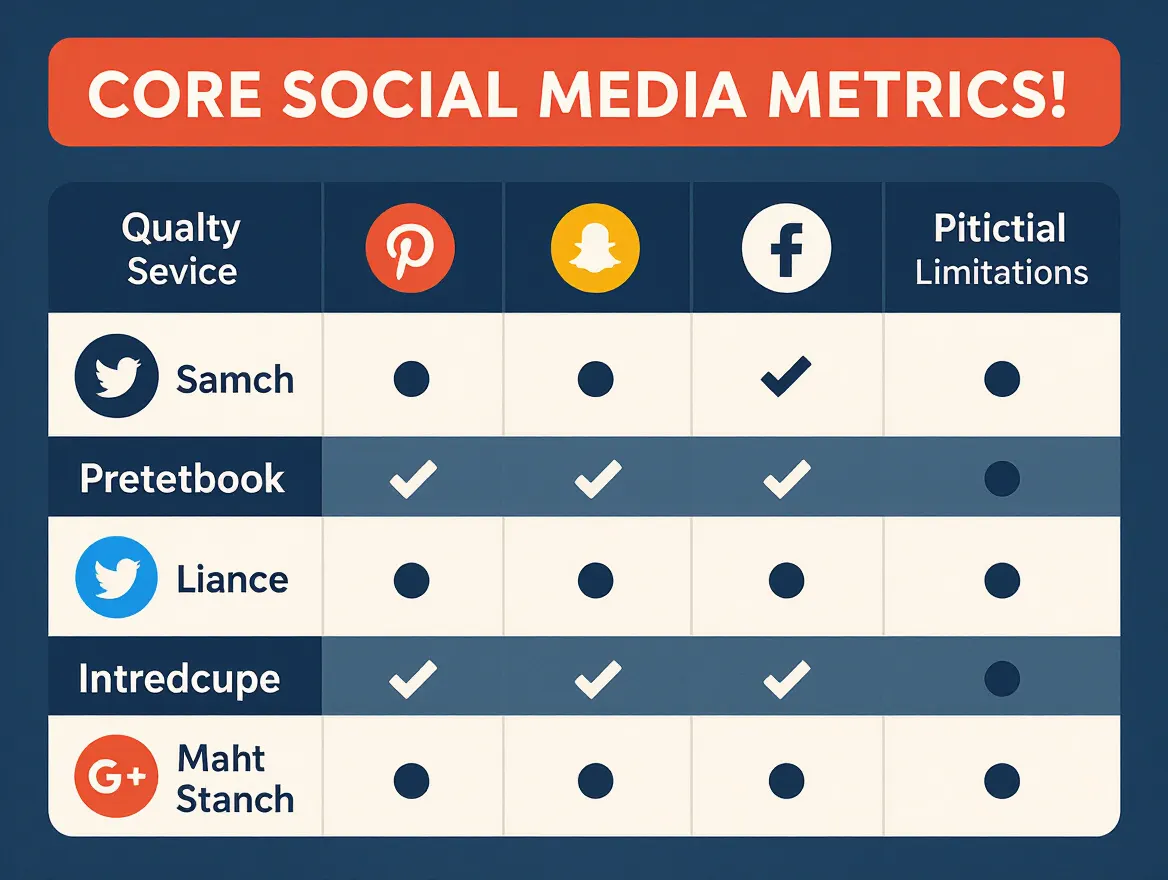
With the evolution of social media metrics in 2026, managers need concise ways to compare what truly matters. The table below summarizes the five key efficiency metrics that drive smarter automation decisions. Each metric addresses a distinct aspect of performance, from channel growth to customer satisfaction. This side-by-side snapshot helps you quickly identify strengths, gaps, and where to invest your attention – especially when evaluating automation tools or reporting frameworks.
| Name | Key Strength | Key Limitation | Best For |
|---|---|---|---|
| Audience Growth | Measures channel health and market expansion over time | Susceptible to vanity focus if not paired with engagement data | Brand awareness, competitive benchmarking |
| Engagement Depth & Momentum | Reveals quality of audience interaction and how quickly engagement compounds | Can be skewed by short-term trends or platform algorithm changes | Evaluating content resonance, community-building |
| Awareness Metrics | Assesses content reach and share of voice versus competitors | Numbers can mislead if not contextualized with engagement or conversion | Brand campaigns, influencer partnerships |
| Conversion Metrics | Connects social efforts to actions like sign-ups, purchases, or downloads | Requires accurate tracking setup and can be affected by external factors (landing pages, offers) | ROI reporting, budget justification, e-commerce |
| Customer Experience | Quantifies response speed, satisfaction, and sentiment | Heavily dependent on data capture and sometimes on survey response rates | Customer service evaluation, reputation management |
Choosing the right mix of efficiency metrics is rarely one-size-fits-all. For instance, automation efficiency guides for managers emphasize aligning metrics with business goals, not just reporting convenience. Meanwhile, deeper analytics – like engagement momentum or sentiment – may require AI-driven add-ons, as described in the latest analytics platform comparisons.
The next step is to clarify which metric aligns with your strategic priorities and automation stack. This table provides a launchpad for that decision, making it easier to match your goals with the right data focus.
Audience Growth Metrics: Gauging Channel Health Beyond Vanity
Audience growth is a vital part of any social media metrics strategy, but it’s often misunderstood as merely a “vanity” indicator. In reality, tracking the pace and pattern of follower growth reveals much more than just how many people clicked “follow.” When you contextualize this data – comparing your growth to industry trends, competitors, and your own historical performance – it becomes a powerful signal of brand awareness and overall channel health.
Key Insight: Audience growth, viewed alongside engagement and market benchmarks, helps you spot early signals of channel momentum or stagnation – long before revenue numbers shift.
For social media managers under pressure to prove impact, growth metrics act as an early warning system. If your follower base is expanding faster than competitors, your content is likely reaching new audiences or resonating in ways that drive visibility. Conversely, flat or declining numbers – even with active core fans – may indicate you’re losing mindshare or missing emerging trends.
Tracking Audience Growth with Automation
Manual tracking – exporting follower counts, calculating deltas, and building charts by hand – wastes valuable time and is prone to error. Automation platforms like PostNext track and chart audience growth for you. PostNext takes a daily follower snapshot for X, Instagram, Threads and TikTok from the day you connect each account, and shows the trend over 7, 30 or 90 days so you can line up growth spikes with campaign launches or viral posts.
For competitor comparisons and industry averages, you need a dedicated benchmarking or listening tool; see this comparison of analytics platforms. That broader context turns a raw follower count into a business signal you can use for strategic decisions.
Before/After: Manual Tracking vs. Automated Dashboards
| Before | After |
|---|---|
| Manual spreadsheet updated weekly with follower counts from each platform. Growth calculated by subtracting last week’s total from the current total. No competitor data; no context for market shifts. Occasional gaps or errors from missed updates. | Automated PostNext dashboard captures follower counts daily. Charts multi-platform growth trends you can compare with your campaign calendar. Period-over-period comparison shows whether growth is speeding up or slowing down. No manual input required. |
The after scenario shows why automation is valuable: you get quicker insight into how your audience is growing, and more time to work out why. This frees up time for higher-value tasks, like refining your content strategy or experimenting with new formats. For a detailed look at how automation improves reporting, see this guide on building an automated social media reporting system.
Limitations: Why Follower Counts Aren’t Enough
While audience growth is a useful barometer, it’s not the whole story. A rising follower count doesn’t guarantee your content is resonating or leading to meaningful conversions. New followers from a viral trend may not translate into engagement or business outcomes. Follower numbers must be paired with deeper engagement analysis – such as saves, shares, and thoughtful comments – to assess real resonance.
Growth trends can also be influenced by factors outside your control, like algorithm changes or platform-wide shifts. Experienced social media managers treat audience growth as one piece of a balanced social media metrics toolkit, not the sole indicator of success.
The true value of audience growth lies in its ability to signal direction and momentum. Used wisely – especially when paired with engagement and conversion metrics – it helps you detect shifts, spot new opportunities, and prove the long-term health of your social channels.
Engagement Depth & Momentum: Moving Beyond Likes
Likes are the easiest metric to chase, but they rarely tell the full story. Social media managers who want to demonstrate business impact are now dissecting engagement depth and the momentum behind every post. This shift is about moving past vanity numbers and understanding what truly signals content resonance, audience loyalty, and long-term value.
Key Insight: Momentum – the pace and compounding effect of quality engagement – tells you more about a post’s staying power than a static total.
| Engagement Type | Depth Indicator | Momentum Score | Platform Example |
|---|---|---|---|
| Like | Low (Easy, fast, low commitment) | Spikes quickly, drops off fast | Instagram double-tap |
| Save | High (Signals intent to revisit or reference) | Often grows over 24-72 hours | Instagram “bookmark” save |
| Share | High (Expands content reach, implies strong endorsement) | Can compound as shares trigger new audiences | Facebook post share, TikTok repost |
| Comment (Substantive) | Medium-High (Indicates thoughtful interaction, discussion) | Builds as conversations unfold | LinkedIn article discussions |
| Direct Message | Very High (Personal, private engagement) | Usually slow but signals strong interest | Instagram DM reply to Story |
Measuring Engagement Momentum: How to Track Over Time
What separates a viral post from a fleeting trend? Momentum metrics answer that question by tracking how engagement unfolds in the hours and days after publishing. Instead of collecting totals, you’re watching the speed, shape, and sustainability of audience response.
Start by plotting engagement events (likes, saves, shares, comments) against time. Posts that attract a flurry of likes but quickly stall may look impressive at first glance, but their impact fades. Posts that spark continual shares, ongoing saves, or extended comment threads indicate compounding audience interest.
When you spot momentum early, you can double down – prompting more discussion, investing in paid boosts, or quickly producing follow-up content. For more practical tips on streamlining measurement, check out this step-by-step guide to measuring social media efficiency with AI analytics.
Limitation: Momentum can be artificially inflated by algorithm changes or paid promotion. Always compare current posts to historical performance and watch for anomalies.
Engagement Depth: Saves, Shares, and Quality Comments
Not all engagement is equal. Saves, shares, and meaningful comments carry more weight than a high like count, as they reflect deliberate action and deeper resonance. A save signals your content is seen as a resource. Shares amplify your reach, turning your audience into advocates. Substantive comments highlight that your content sparked real conversation or debate.
For example, a post with 200 likes and 5 shares might seem successful, but another post with 30 likes and 20 saves may have greater staying power. Social media managers are increasingly scrutinizing these qualitative engagement signals to identify what actually drives brand loyalty and business outcomes.
Platform definitions matter. What counts as a “save” on one network may not exist on another, and the value of a share can vary depending on whether it appears in a feed or a story. For more on adapting your metric mix to different platforms and goals, see this 2026 guide to building a high-performance social media workflow for remote teams.
Tool Spotlight: AI Analytics for Engagement Tracking
Manual tracking of engagement quality and momentum is tedious and error-prone, especially across multiple channels. Analytics platforms help by breaking engagement into its parts. PostNext, for example, reports likes, comments, saves, shares, reach and engagement rate for each X, Instagram, TikTok and LinkedIn post, and lets you filter by content pillar, so you can see which themes earn saves and shares rather than just likes (the exact metrics depend on what each network’s API provides). Engagement-over-time views show whether a post kept earning after day one. For a granular look at how AI analytics can sharpen your approach, read the full breakdown on measuring social media efficiency with AI analytics.
One caveat: Even the smartest tools depend on clean data and context. If your audience or algorithms shift, always calibrate your benchmarks and watch for outliers before making strategic changes. For nuanced perspectives on balancing automation and authenticity, visit this opinion piece on automation vs. authenticity in social media marketing.
Awareness Metrics: Reach, Impressions, and Share of Voice
Why Awareness Metrics Matter for Social Media Managers
Awareness metrics – specifically reach, impressions, and share of voice – are essential for understanding content visibility at scale. They answer the question: How many people are actually seeing your posts? For managers juggling multiple platforms, these numbers help monitor whether a campaign is gaining traction or fading into the background. Share of voice, in particular, benchmarks your brand’s visibility against competitors, showing whether your content stands out.
However, high reach or impressions alone rarely indicate business impact. Many managers have seen posts rack up thousands of impressions, only for those views to result in little engagement or conversion. If your goal is real-world results, you can’t view awareness in isolation. Contextualizing these social media metrics with engagement trends and momentum is essential. For a deeper discussion on why depth and momentum matter, see this comparison of analytics platforms and how modern AI tools are shifting the focus.
The Platform Nuance Problem
Each social network defines and counts its metrics differently. A “view” on TikTok is not measured the same way as a “view” on YouTube. Even basic numbers like reach can play out differently across Facebook, Instagram, LinkedIn, and X. As a result, it’s easy to misinterpret performance when comparing across platforms or aggregating data in a dashboard. The table below outlines some of the most common awareness metrics, how major platforms define them, and where their limitations lie.
| Metric | Platform Definition | Contextual Limitation |
|---|---|---|
| Reach | Unique accounts that saw your content (e.g., Facebook/Instagram) | Does not reflect repeated exposures; may overstate unique audience if users have multiple accounts |
| Impressions | Total number of times content was displayed (not unique; all major platforms) | High impressions can result from a small audience viewing content repeatedly; not a direct measure of influence |
| Share of Voice | Percentage of total mentions or visibility relative to competitors (e.g., monitored via brand listening tools) | Heavily dependent on keyword setup and platform coverage; can miss untagged or indirect mentions |
| Video Views | Varies by platform, and definitions change (check each platform’s current help pages) | Short thresholds can inflate view counts; not all views indicate real attention |
| Mentions | Count of direct brand tags or mentions (all platforms) | Misses non-tagged references; context (positive/negative) not always clear |
For managers aiming to show impact, awareness metrics are best used as directional signals, not final verdicts. They help spotlight what’s gaining surface-level exposure, but the real story emerges only when you layer in engagement and conversion data. For a practical framework for interpreting awareness metrics in context, this step-by-step guide to measuring social media efficiency offers actionable advice.
Conversion Metrics: From Social Action to Business Results
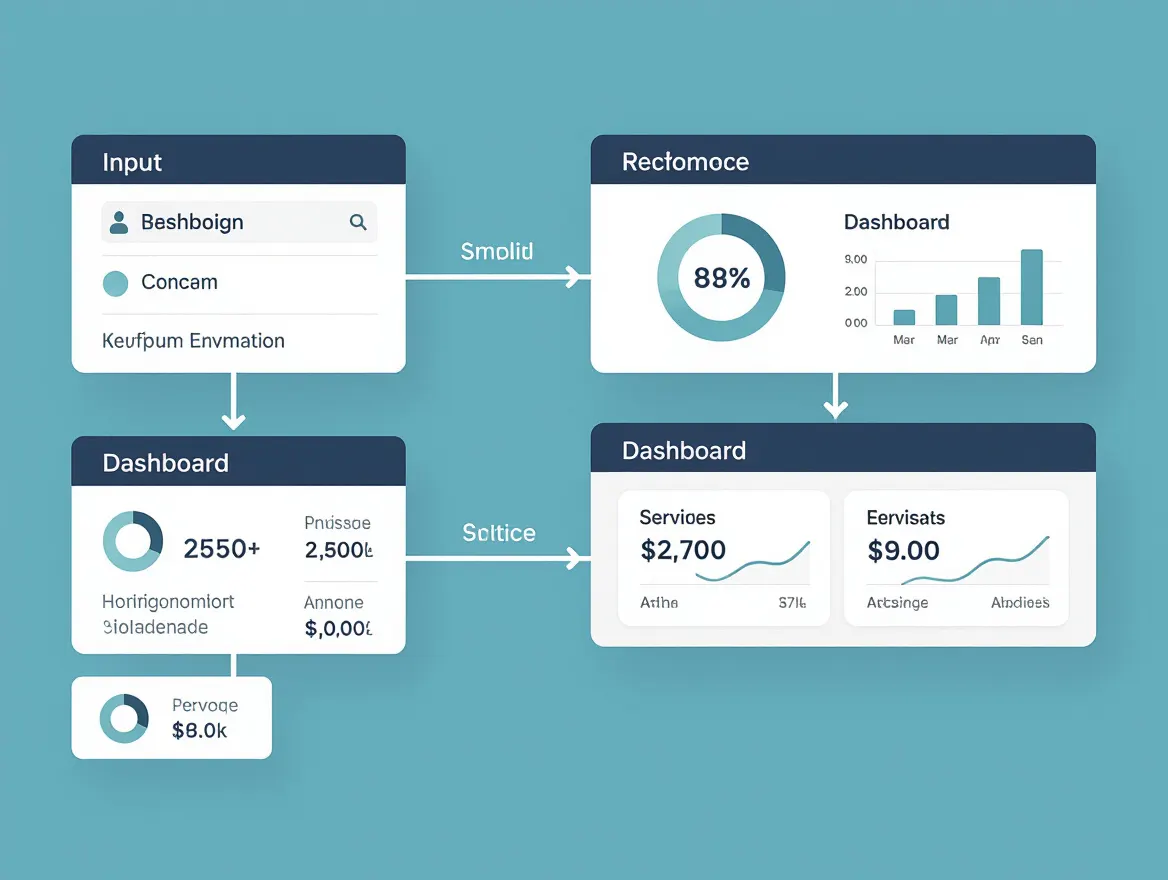
For all the focus on engagement and reach, conversion metrics are where social campaigns prove their value. If you want to show how your efforts fuel business results – whether that’s revenue, leads, or sign-ups – these are the numbers that matter. Click-through rate (CTR), conversion rate, and tracked conversions serve as the clearest links between social activity and business KPIs. Yet, making these connections clear – and automating the process – remains a challenge for many teams.
Key Insight: Automated attribution and reporting are turning social media metrics into actionable business intelligence, but gaps remain due to privacy and platform silos.
Optimizing Conversion Funnels with Automation
Conversion funnels are rarely linear, especially in social media. A post may spark curiosity, but the actual click, signup, or sale might happen weeks later, after multiple touchpoints. This is why automation is now essential for identifying where users drop off and refining your calls to action (CTAs).
With web analytics and UTM-tagged links, you can track each step of your audience’s journey, from the click on a post to the final conversion event. (Social schedulers such as PostNext report on-platform engagement, not conversions, so this part lives in your web analytics.) Connected analytics let you spot friction points: Are users clicking your link but abandoning the form? Is a particular CTA underperforming on Instagram compared to LinkedIn? These are daily realities for social media managers.
By surfacing granular data quickly, automation makes it possible to adjust creative, timing, and messaging without waiting weeks for a manual report. For example, you might notice that a carousel post drives plenty of clicks, but the landing page isn’t mobile-optimized, leading to a high drop-off rate. With this insight, you can quickly improve the user experience and test new CTAs. For a step-by-step walkthrough of setting up automated reporting, see this guide to building an automated social media reporting system.
Linking Social Metrics to Business KPIs
Social media metrics are only valuable when they tell a story your leadership cares about. The most effective teams align conversion metrics with broader business goals – not just vanity numbers, but actual outcomes that drive growth. That means translating clicks and conversions into revenue impact, lead quality, or customer acquisition cost.
Start by defining which conversions matter for your business: Is it trial sign-ups, product purchases, or email captures? Make sure your tracking setup attributes these events back to specific social posts or campaigns. This alignment is crucial, as many marketing leaders now face pressure to prove social media’s business impact. Automated dashboards can consolidate campaign data and generate regular reports; combine social engagement from your scheduler with conversion data from web analytics to present ROI to stakeholders. For a comparison of how leading platforms handle attribution, check out this analytics platform comparison.
Best practices also include contextualizing your conversion data. A high CTR is positive, but if conversions remain flat, you may have a disconnect between your content and your landing experience. Review channel-specific benchmarks and look for patterns over time, not just one-off spikes. Momentum matters: a campaign that steadily improves conversion rate over several cycles will be more valuable than one that peaks early and fades.
Honest Limitation: Attribution in a Fragmented World
Despite advances, attribution remains a challenge. Privacy changes – such as app tracking transparency and browser restrictions – regularly disrupt cross-platform tracking. Not all conversions will be captured, especially as users jump from social app to web to email. Data silos between platforms can further muddy the picture.
Automation tools reduce friction and simplify reporting, but no system can deliver perfect attribution across the entire digital journey. The best approach is to maximize the data you have, continue testing, and communicate both wins and gaps to your team. For practical strategies to address these issues, the guide to data privacy in social media automation offers a realistic perspective.
The future of social media metrics lies in treating conversions as part of a broader measurement strategy. Automation gets you closer to the truth, but context and human judgment remain essential.
Customer Experience Metrics: Response Time, Satisfaction, and Sentiment
For brands using social media as a customer service channel, customer experience metrics are essential. Average response time, response rate, net promoter score (NPS), customer satisfaction (CSAT), and sentiment analysis all quantify how well your support team serves customers in real time – and how your brand is perceived publicly.
Key Insight: Monitoring customer experience on social channels is about more than speed; it’s about using the right social media metrics to surface satisfaction, frustration, and urgency at scale.
Fast response times send a clear message: you value your audience’s time. When you answer support queries quickly and resolve issues publicly, you boost loyalty and show prospective customers that you’re listening.
But volume alone isn’t enough. Response rate – the percentage of messages actually answered – reveals whether you’re keeping up. NPS and CSAT surveys translate qualitative experiences into actionable scores. Sentiment analysis, powered by AI, attempts to gauge the emotional tone of customer interactions at scale, flagging potential PR risks or emerging pain points.
Automation has fundamentally changed how teams track and act on these metrics. Modern platforms prioritize urgent messages, escalate negative sentiment, and generate satisfaction reports without manual effort. For an in-depth look at how automation can reshape social customer service, see 5 Ways Automation Can Transform Social Media Customer Service in 2026.
Automating Customer Experience Tracking
Traditional customer experience tracking meant reviewing countless DMs, comments, and brand mentions by hand. Today, social customer-care tools aggregate customer messages from across platforms, analyze their content for sentiment, and display key metrics in a single dashboard. (PostNext is not one of them: its engagement inbox lets you read, reply to and delete Instagram comments, without sentiment, response-time or urgency tagging.)
With a dedicated care tool, you can see at a glance which inquiries are unresolved, how your average response time is trending, and whether sentiment is shifting after a campaign or product launch. Over time, you begin to spot patterns: are negative comments spiking after shipping delays? Is CSAT higher when support replies in under an hour?
These aggregate views keep support teams accountable and make it possible to tie social media metrics back to broader business KPIs. You can compare NPS from social interactions to other touchpoints or track improvements in CSAT after rolling out automation. The value is in surfacing actionable insights that drive process change.
For teams looking to go further, integrating analytics with workflow automation can trigger real-time alerts or even auto-responses – reducing lag and keeping customers satisfied. This kind of end-to-end tracking is covered in posts like How to Measure Social Media Efficiency With AI Analytics: Step-by-Step Guide for Agencies and Teams (2026).
Limitation: While AI-driven sentiment analysis scales effortlessly, it can misinterpret sarcasm, cultural references, or context. Human review is still necessary for reputation-critical issues.
Before/After: Manual Monitoring vs. Automated Alerts
| Before (Manual Monitoring) | After (Automated Alerts) |
|---|---|
| • Support rep checks brand mentions and DMs every few hours. • High volume leads to missed urgent complaints or late responses. • Response time metrics lag behind, and negative sentiment isn’t flagged until it escalates. • CSAT and NPS are tracked via occasional, manually sent surveys. | • Automated system pulls all customer messages into a unified dashboard in real time. • AI flags negative sentiment and escalates urgent issues instantly. • Average response time improves, and no customer message goes unanswered. • NPS/CSAT surveys are triggered automatically after issue resolution, feeding results directly into analytics. |
Automation removes bottlenecks, enabling teams to respond faster and prioritize what matters. When sentiment analysis and satisfaction surveys are integrated into the workflow, you get a continuous, accurate picture of customer health – not just periodic snapshots.
For a practical deep dive into automating alerts and triaging support, explore how automation is changing social media customer service.
Ultimately, customer experience metrics are the heartbeat of social support in 2026. Customer-care tools give teams the ability to track, visualize, and improve these metrics efficiently, but leaders should recognize the limits of AI when it comes to nuance and context. Social media metrics are only as useful as the actions they inspire – and the human touch remains irreplaceable for the toughest support moments.
How Automation Supercharges Social Media Metrics
Tracking social media metrics has evolved from a tedious, manual chore to a streamlined, high-impact discipline – largely thanks to automation platforms. For managers, the shift is significant. Instead of wrestling with scattered spreadsheets and delayed analytics, you get regularly refreshed insights that show what happened and help you decide what should happen next.
Today’s automation tools surface trends, spot anomalies, and suggest next steps, letting you focus on strategy rather than data wrangling. The result: efficiency metrics that actually drive better business outcomes, not just prettier dashboards.
Automation and the Workflow Shift
Manual reporting was always vulnerable to human error – missed data points, inconsistent benchmarks, reports that never arrived on time. AI-driven automation solves this by pulling data from each connected channel, synthesizing it, and flagging significant changes as they happen. Instead of spending hours compiling reports, teams can reallocate that time to campaign planning, creative reviews, or customer engagement. Automation doesn’t just save time – it raises the bar for what’s possible.
Some platforms add trend detection and alerts, so you do not have to wait for a weekly report to spot a spike in engagement or a sudden drop in conversions. This means you can double down on what’s working – or fix what isn’t – while it still matters.
For a practical look at how automation transforms team efficiency, see these 10 automation efficiency hacks for social media managers.
What Real-Time Metrics Enable
- Continuous benchmarking against past performance and industry standards, taking the guesswork out of goal-setting.
- Momentum tracking so you spot not just engagement totals, but how quickly your audience responds and whether that momentum is compounding.
- Unified reporting across platforms, which is crucial now that each social network defines metrics differently (a “view” on TikTok is not the same as on YouTube).
- Data-driven recommendations that suggest when to post, which content themes to push, or how to adjust your paid budget in response to live conversion rates.
The integration of analytics, scheduling, and reporting powers this next-level visibility.
AI Scheduling and Analytics in Practice
Modern solutions like PostNext connect scheduling and analytics. You can plan and publish content, then check its performance as the numbers refresh, with no exporting, importing, or juggling disconnected tools. On paid plans, PostNext ranks the posting slots where your own posts earned the most engagement over the last 90 days, so the next schedule builds on what worked.
What makes this approach powerful is the feedback loop: metrics drive scheduling, scheduling drives new metrics, and every iteration sharpens your overall strategy. Managers can finally act on the data instead of just reviewing it. For an in-depth breakdown of how this plays out in daily workflows, check out our full guide to social media automation efficiency hacks.
Risks and Limits: Where Human Judgment Still Wins
Despite the benefits, over-relying on automation can introduce blind spots. AI can surface trends and anomalies, but it won’t always understand context or nuance – like why a particular meme format is suddenly popular, or how audience sentiment shifts after a PR incident. Sometimes, the best-performing content isn’t what the algorithm expects. Even the best automation platforms should be used as decision aids, not total replacements for hands-on management. Human intuition about tone, timing, or cultural relevance still matters. For more on finding this balance, see this opinion piece on balancing automation and authenticity.
Automation is changing what’s possible with social media metrics. The real value comes from blending AI-powered efficiency with thoughtful, context-aware strategy. That’s the sweet spot for teams aiming to both measure and move the needle in 2026.
How to Choose: A Decision Framework for Social Media Metrics
Start With Your Business Objectives
Every solid social media strategy begins with business objectives. Are you aiming to build brand awareness, drive conversions, improve customer satisfaction, or justify your ad spend? Your answers shape which social media metrics actually matter. For example, a SaaS startup seeking rapid growth will focus on audience momentum and sign-up conversions, while a customer service-driven brand should prioritize response rates and sentiment scores.
Match Metrics to Goals, Not Platforms
It’s easy to get distracted by high-profile numbers – impressions, likes, even follower surges. But those are only meaningful if they tie back to your business goals. Engagement depth (such as saves or shares), conversion rates, and response times reveal more about content effectiveness than generic counts.
Aim to balance both leading indicators (like momentum in engagement or new followers) and lagging indicators (such as sales or NPS) for a clear, actionable view. Marketers who combine these perspectives are better equipped to adapt as algorithms and audience behaviors shift. For those managing complex, multi-channel strategies, platforms like PostNext and Socialinsider pull diverse metrics into one dashboard, making it easier to spot patterns and take action. See this step-by-step guide to measuring social media efficiency with AI analytics for a practical example.
Revisit and Refine as You Grow
Social media is not static. As your brand evolves or platforms introduce new features (think short-form video or in-app shopping), your metrics mix should shift too. What mattered for awareness in 2024 might be irrelevant in 2026. Schedule routine reviews – monthly for most metrics, but weekly for fast-changing platforms or campaigns.
| Goal | Best Metric(s) | Recommended Tool | Frequency of Review |
|---|---|---|---|
| Brand Awareness | Reach, Follower Growth (Share of Voice needs a listening tool) | PostNext, Socialinsider | Monthly |
| Audience Engagement | Shares, Saves, Meaningful Comments, Engagement Momentum | PostNext, Native Platform Analytics | Weekly |
| Lead Generation & Conversion | Click-Through Rate, Conversion Rate | Google Analytics, Looker Studio | Monthly |
| Customer Service & Experience | Average Response Time, CSAT, Sentiment Analysis | Third-Party CX Tools | Weekly |
| Paid Campaign ROI | CPC, CPM, ROAS | Native Ad Managers, Google Analytics | After Each Campaign |
Remember, social media metrics are only as valuable as the context in which you interpret them. Prioritize what moves your business forward, adjust as your strategy evolves, and let the numbers guide smarter decisions instead of dictating them.
Limitations and Pitfalls: Interpreting Social Media Metrics Wisely
Context Is Everything: Avoiding Vanity Traps
It’s tempting to chase big numbers – a spike in followers, a viral post’s avalanche of likes. But not all engagement or growth is created equal. For example, a flood of likes can feel rewarding, yet it may have little connection to actual business goals like conversions or customer retention. What matters is how these metrics tie back to your objectives, not how impressive they look in a dashboard.
Platform differences add another layer of complexity. A “view” on one network doesn’t mean the same thing as a “view” elsewhere. For example, what TikTok counts as a view is distinct from YouTube’s definition, so comparing metrics across channels without understanding these nuances leads to misinterpretation. Tools like PostNext help consolidate data, but you still need to interrogate what each number actually represents.
The Dangers of Chasing the Wrong Metrics
Focusing on the wrong metrics – vanity or otherwise – can steer your strategy off-course. If your team prioritizes follower growth but ignores conversion rates, you might miss that your content isn’t driving real business impact. As the latest comparison of AI analytics tools points out, aligning your measurement approach with your specific goals is non-negotiable.
Metrics also lose relevance as platforms and algorithms evolve. What worked in 2023 might be obsolete by 2026, especially with the rise of AI-driven feeds and short-form video. It pays to regularly audit both your metrics and the tools you use. Outdated or mismatched analytics can create a false sense of progress, wasting time and resources.
Interpreting social media metrics wisely requires skepticism, regular review, and a willingness to adapt. Compare performance to your own benchmarks, not just industry averages, and don’t hesitate to update your approach when the data – or your business priorities – shift. For a deeper look at measurement frameworks and avoiding automation missteps, see our guide to automation mistakes in 2026.
Frequently Asked Questions
What are the most important social media metrics for efficiency?
The most important metrics include engagement depth, conversion rates, and customer experience metrics. These provide insight into how effectively your social media efforts drive business outcomes.
How can automation tools improve metric tracking?
Automation tools streamline data collection and analysis, providing real-time insights and reducing manual errors. They allow you to focus on strategy by surfacing trends and suggesting actionable steps.
Are engagement metrics still relevant in 2026?
Yes, engagement metrics remain crucial as they indicate audience interaction and content resonance. However, focus on depth and momentum rather than vanity metrics like likes.
How do I connect social media metrics to business ROI?
Link your metrics to business goals by tracking conversions, revenue impact, and customer acquisition costs. Use attribution tools to connect social actions to tangible outcomes.
What’s the difference between reach and impressions?
Reach refers to the number of unique users who see your content, while impressions count the total views, including multiple views by the same user.
How often should I review my social media metrics?
Review frequency depends on the metric type: weekly for fast-changing metrics like engagement, and monthly for broader metrics like brand awareness.
What are the limitations of using AI for social media analytics?
AI can misinterpret context and nuance, such as sarcasm or cultural references. Human oversight is necessary for critical analysis and decision-making.
How do I benchmark my efficiency metrics against competitors?
Use tools that offer competitor analysis and industry benchmarks. Compare your metrics to these standards to identify areas for improvement.
Powered by PostNext service