
Twitter analytics, now X analytics, has two parts. Every post shows its views, likes, replies, reposts and bookmarks to anyone, for free. The account dashboard at x.com/i/account_analytics, with impressions over time, engagement rate, profile visits and link clicks, is listed as Advanced Analytics on X’s paid plans. You can still track the core numbers for free with a simple log.
Key Takeaways
- Post numbers are public: X shows the view count on every post to everyone, and its developer docs list impressions, likes, reposts, replies, quotes and bookmarks as public metrics.
- The dashboard is on paid plans: X’s plan page lists Advanced Analytics from the Plus plan up. The Free plan lists post, reply and follow.
- Impressions count showings, not people: one person who sees your post twice counts twice, and your own views count too.
- Engagement rate is engagements divided by impressions: X’s engagements include clicks anywhere on the post, so the rate runs higher than likes alone suggest.
- Profile visits and link clicks are private: only the author sees them, and X’s API keeps them for posts from the last 30 days.
- Compare per post, not per week: divide by the number of posts so one busy week does not hide what works.
How do you see your Twitter analytics on X?
On a computer, sign in and go to x.com/i/account_analytics. On a phone or the web, tap the chart icon under one of your posts, next to its view count, to see that post’s numbers. X lists the account dashboard as Advanced Analytics on its paid plans, so a free account may see an upgrade screen instead.
Three places hold your numbers:
| Where | What you see | Who can see it |
|---|---|---|
| Under each post | Views, replies, reposts, likes, bookmarks | Anyone on X |
| Post activity (chart icon on your own post) | How people viewed and engaged with that one post | You |
| Account analytics (x.com/i/account_analytics) | Total impressions, engagement rate, profile visits, link clicks, video performance | You, on a paid plan |
X retired its old help page for the dashboard. The page now sends you to the account analytics screen on x.com, which needs you to sign in (web.archive.org captures of help.x.com, October and November 2026).
Is Twitter analytics free?
Partly. The public numbers on every post are free: views, replies, reposts, likes and bookmarks. The account analytics dashboard is not. X’s plan page lists Advanced Analytics as a feature of Plus and higher, and the Free plan lists only post, reply and follow (x.ai, November 2026). Social Media Today reported in June 2024 that X made all account analytics paid-only.
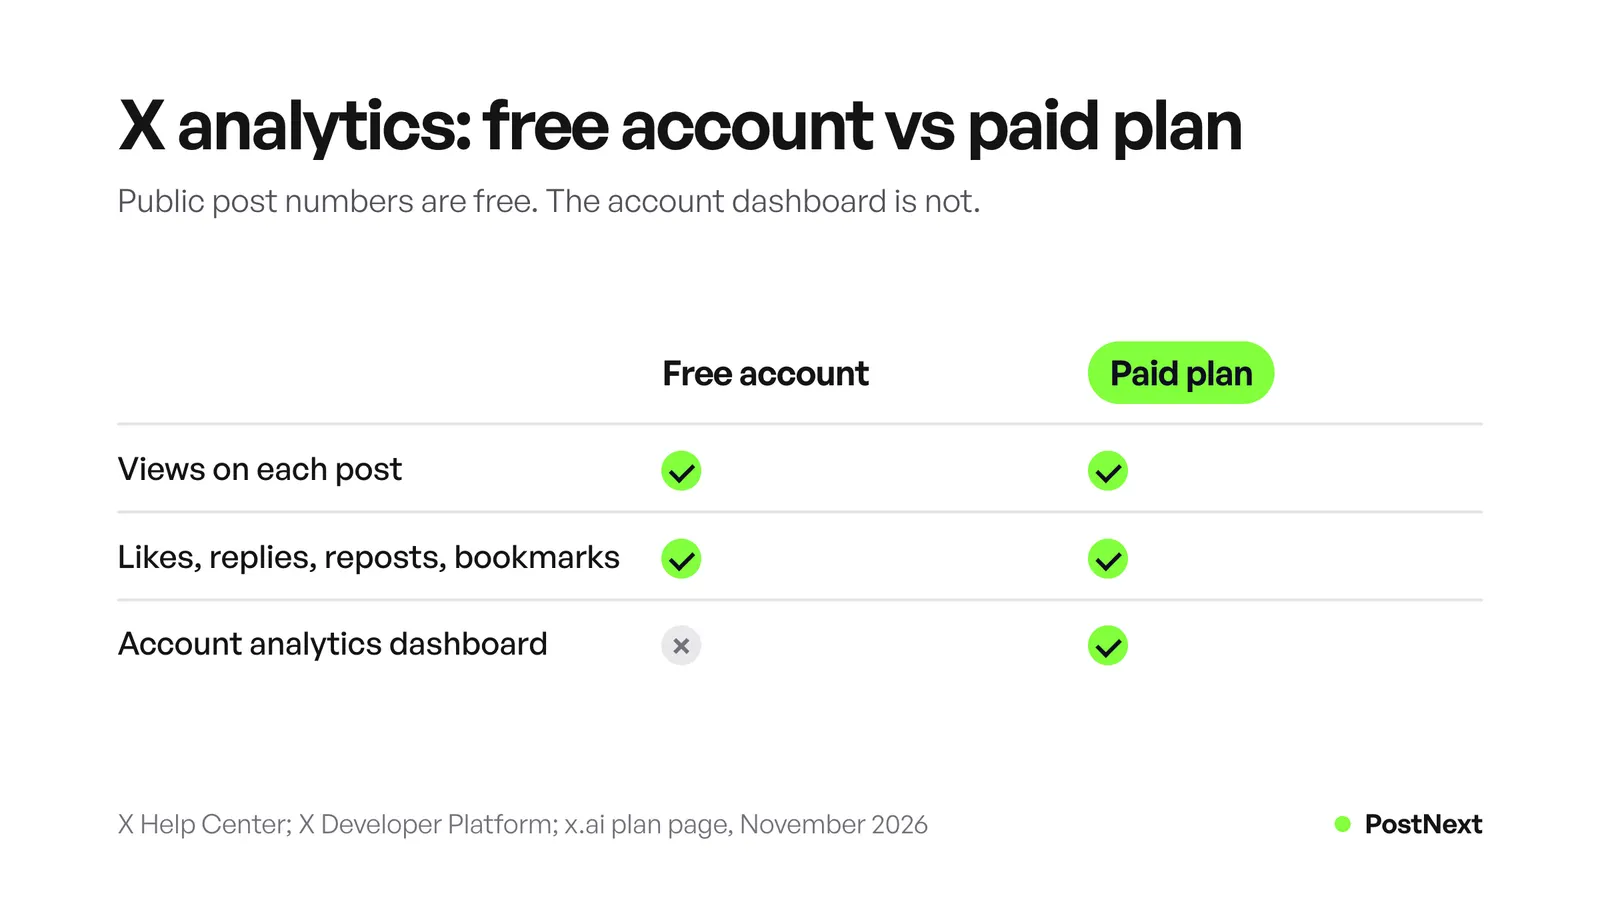
What that means in practice:
- Free accounts can read the public counts on any post, their own and other people’s. That is enough to compare your own posts, if you write the numbers down.
- Paid accounts get the dashboard, which adds total impressions, engagement rate, profile visits, link clicks and video performance without the manual work.
Our guide to X Premium plans lists what each plan adds besides analytics. If analytics is the only reason to pay, try the free route below first.
What are impressions on Twitter?
An impression is one time X shows your post to someone. X’s own definition was “times a user is served a post in timeline or search results”. It counts showings, not people: one person who scrolls past your post twice adds two. On each post, X now shows this number as views, visible to anyone, and your own views count too.
X’s View counts help page adds three details (help.x.com, November 2026):
- Who counts: anyone logged in who sees the post, in Home, Search, a profile or anywhere else, whether or not they follow you.
- Repeats count: looking at a post on the web and then on your phone counts as two views.
- Some posts have none: Community posts, X Circle posts and older posts show no view count. Embedded posts on other websites do not add views.
Impressions are not reach. Reach is the number of different people, and X does not show it. The lesson on reach vs impressions explains the difference with one example. For X’s payout program, only some impressions count: unique ones from Premium users on the Home Timeline. Our guide to X creator revenue sharing explains that rule.
What counts as an engagement on X?
X counts an engagement each time someone interacts with your post. Its definition covers clicks anywhere on the post, including reposts, replies, follows, likes, links, cards, hashtags, media, your username, your profile photo and opening the post. That makes engagements much larger than likes plus replies, and it is the number X uses for engagement rate.
| Metric | What X counts | Who can see it |
|---|---|---|
| Impressions (views) | Times the post was shown, repeats included | Anyone |
| Likes, replies, reposts, quotes, bookmarks | Each action on the post | Anyone |
| Engagements | Every interaction, including clicks anywhere on the post | You |
| Engagement rate | Engagements divided by impressions | You |
| Profile visits | Clicks on your name, @username or profile photo | You |
| Link clicks | Clicks on a link or card in the post | You |
The definitions come from X’s archived help page for the post activity dashboard. The public and private split comes from X’s developer docs on metrics, which also say private, organic and promoted metrics are only available for posts created in the last 30 days (docs.x.com, November 2026).
How do you calculate engagement rate on X?
Divide engagements by impressions and multiply by 100. For example, a post with 2,000 impressions and 40 engagements has a 2% engagement rate. X uses this definition in its own analytics. If you only see public numbers, use likes, replies, reposts and bookmarks as the engagements, and say so, because your rate will be lower than X’s.
Three rules keep the number useful:
- Use one formula everywhere. A rate on impressions and a rate on followers are different numbers. Mixing them makes every comparison wrong.
- Compare similar posts. A thread, a single post with an image and a reply in a busy conversation behave differently. Compare each with its own kind.
- Read rate and impressions together. A 10% rate on 80 impressions tells you little. A 1.5% rate on 40,000 impressions can be your best post of the month.
The free engagement rate calculator does the division for X, Instagram, TikTok and LinkedIn.
What do profile visits and link clicks tell you?
Profile visits show how many people clicked your name, @username or photo from a post. Link clicks show how many clicked a link or card in it. They are the two numbers closest to a result, a new follower or a visit to your site. Only the author sees them, in post activity or the account dashboard.
Read them as a ratio to impressions. A post that gets many impressions but few profile visits entertained people without making them curious about you. A post with fewer impressions and many profile visits is the kind to repeat if you want followers. If you sell something, link clicks per 1,000 impressions is the number that ties X to revenue.
For link clicks, compare them with the visits your own website analytics records from X. Expect the two to differ, and compare trends rather than single numbers.
How can you track X analytics for free?
Keep a simple log. Once a week, copy each post’s views, likes, replies, reposts and bookmarks into a sheet, with the date, the time and the post type. After four weeks you can see which kinds of posts and which hours do best. The public numbers are enough for that, and they cost nothing.
A sheet with these columns does the job:
- Date and time posted
- Post type: single, thread, image, video, reply, poll
- Topic
- Views, likes, replies, reposts, bookmarks
- Engagements per 1,000 views (likes + replies + reposts + bookmarks, divided by views, times 1,000)
Copy the numbers 7 days after each post, so every post has had the same time to collect views. X’s For You code drops posts older than 48 hours from ranking, so most views arrive early. When a pattern shows up, test it: post the winning type at the winning hour for two weeks and compare. Our guide to the best time to post on X shows how to test hours with your own numbers.
How PostNext shows your X analytics
PostNext collects analytics for the X posts you publish through it. For each post it shows impressions, likes, replies and engagement rate, and it tracks your X follower count every day. You can view 7, 30 or 90 days, or everything since you connected the account, and export a CSV or PDF on paid plans.
The analytics page lists what PostNext collects per network. Three details matter for X:
- History starts on the day you connect. PostNext does not import older posts, and it covers posts published through PostNext.
- The overview and follower trend are free. Engagement over time, best time to post and exports need a paid plan.
- Best time to post uses your own posts. On X, PostNext ranks time slots by engagement on your posts from the last 90 days.
If you schedule with the X scheduler, the numbers for each scheduled post arrive in the same place, so the weekly log above fills itself. To send the numbers to a team or client, see how to automate social media reporting.
Frequently Asked Questions
How do I see my analytics on X?
On a computer, sign in and go to x.com/i/account_analytics. For one post, tap the chart icon next to its view count. The account dashboard is listed as Advanced Analytics on X’s paid plans, so free accounts may see an upgrade screen.
Is X analytics free?
The public numbers on every post are free: views, likes, replies, reposts and bookmarks. The account dashboard, with totals over time, engagement rate, profile visits and link clicks, is listed as a paid-plan feature on X’s plan page. You can track the public numbers for free in a spreadsheet.
What is a good engagement rate on X?
X does not publish a benchmark, and published averages vary with the sample and the formula used. The useful comparison is with your own account. Take your last 20 posts, find the middle value of their engagement rates, and treat posts above it as the ones to learn from.
Are views and impressions the same on X?
X now shows the public count under each post as views. Its developer docs list impressions as the public per-post metric, and its older dashboard defined impressions as times a post was served. Both count repeat showings to the same person, so neither tells you how many different people saw a post.
Why are my impressions on X low?
Most views arrive in the first day or two, because X’s For You code stops ranking posts older than 48 hours. Low numbers can mean the post went out when few followers were online, or that early readers did not react. Compare it with your other posts of the same type before you change anything.
Can I see who viewed my posts on X?
No. X shows how many times a post was viewed, not who viewed it. Likes, replies and reposts show names because they are public actions. Profile visits and link clicks are counts only.
Sources
- X Help Center, View counts: who counts as a viewer, repeat views and posts without counts (archived 3 November 2026, read November 2026)
- X Help Center, About your activity dashboard: metric definitions (archived 2 June 2024, the last version before X redirected the page to x.com analytics; read November 2026)
- X Developer Platform, Metrics: public and private metrics and the 30-day limit (read November 2026)
- xAI, The X Subscription plans: Advanced Analytics on paid plans, Free plan features (archived 18 November 2026, read November 2026)
- Social Media Today, “X launches advanced analytics for X Premium subscribers”, 13 June 2024 (secondary source)
- xAI, X For You feed algorithm: the 48-hour age filter (README, read October 2026)
- PostNext, postnext.io/features/analytics and postnext.io/channels/x (read November 2026)